Generating Network Diagrams from Netbox with Pynetbox
Here’s my typical disclaimer: I’m not a developer. I have the ability to make code give me an expected output, but I do not do anything “the right way.”
All the code I write for these blog posts is in my Github repo that you can and should freely copy and modify. Here’s the environment I’m running this stuff in. Python. Pynetbox. You know the drill by now.
Python         :  3.9.10
Pynetbox       :  7.0.0
Netbox version :  3.5.8
We’ve been working through some stuff, and, at this point, we have a lot of stuff in our Netbox instance. Let’s step up the game a little, though, and see if we can’t generate a network diagram based on that data. Let’s set some expectations, though. This is not going to be comparable to that Visio diagram you’ve managed by hand for the last 8 years. This is going to be a very simple diagram with subnet, nodes, and IP addresses — enough for an auditor or for some architect who doesn’t know what’s in their own data centers.
The logic is pretty easy. The first thing we do it query for all our prefixes. That is, we’ll get all the subnets that Netbox knows about. We then ask Netbox to show us all the IP addresses that are part of these subnets. We wave our hands around a bit and then use Graphviz to plot them out for us.
Here’s some code. I’m leaving out the stuff we’ve done over and over — like getting creds, generating tokens, setting up the logging, etc. I think I jumped ahead a couple steps with our evolution of logging here, so just know that logger is a logging object.
pynetbox_gen_diagram.py
<SNIP>
import graphviz
<SNIP>
# The graph
graph = graphviz.Graph("Network Diagram", engine="neato")
graph.graph_attr['overlap'] = "False"
graph.graph_attr['splines'] = "curved"

# The prefixes in NB
nb_prefixes = nb_conn.ipam.prefixes.all()

for prefix in nb_prefixes:
    if prefix.status.value == "container":
        logger.debug(f"Skipping {prefix} since it's a container.")
        continue
    prefix_addresses = nb_conn.ipam.ip_addresses.filter(parent=prefix.prefix)
    if len(prefix_addresses) < 1:
        logger.debug(f"{prefix} doesn't have any children. Skipping.")
        continue
    else:
        logger.debug(f"Adding {prefix} to the diagram.")
        # graph.node(prefix.prefix, label=prefix.prefix, name=prefix.prefix)
        graph.node(prefix.prefix, style="filled", fillcolor="brown")
    for address in prefix_addresses:
        logger.debug(f"Adding {address} as a node.")
        graph.node(address.assigned_object.device.name, shape="rectangle", style="filled", fillcolor="green")
        logger.debug(f"Adding an edge from {address.address} to {prefix.prefix}")
        # graph.edge(address.assigned_object.device.name, prefix.prefix, taillabel=address.address, arrowhead="none", fontsize="8pt")
        graph.edge(address.assigned_object.device.name, prefix.prefix, taillabel=address.address, fontsize="8pt")

logger.debug(graph.source)
graph.render(view=True)
<SNIP>
Line 5 – 7 set up the graph. Make sure to read over the Graphviz documentation so that I’m not the only one that suffers from “I’m not a data scientist” syndrome. The diagram is going to be titled “Network Diagram” and will use the Neato layout engine, which is a whole other topic that I am not qualified to speak about. Just search “graphviz layout engines” to learn more.
Line 10 gets all the prefixes. We’ll go through each one.
Line 13 is interesting. Netbox includes prefix containers (look here for an explanation), which is just a way to logically organize prefixes. If you do something like “All our sites are 10.<SITE>.<VLAN>.X”, then you would have a container for each site listed as 10.<SITE>.0.0/16. These will only be parents to other prefixes and will not (should not?) contain IP addresses themselves, so we’ll just ignore those.
Line 16 is a pretty good query to remember. We’re querying all IP addresses that are contained in each prefix, so, instead of getting all the IP addresses and figuring out where each live, let’s make Netbox do all the work and only show us the ones we care about.
Line 17 makes sure that the prefix actually has IP addresses in it. If the prefix is defined without any addresses in it (the length of the query is < 1), we don’t want it to clutter up our diagram. If it actually does contain an IP address, we’ll add it to the graph on line 23 with the node method.
Starting on line 24, we go through all the IP addresses and add them to the graph. We also add an edge (which is just a line) between the prefix node and IP address node.
Line 26 deserves some attention here. It wouldn’t make sense to add just the IP address to the diagram, so we’re setting the name of the node (by default, the text on the node) to address.assigned_object.device.name. This is the name of the device that is associated with this address in Netbox.
When we add the edge on line 29, we set a taillabel, which is some text on the tail (origin) end of the edge. We added the edge as from the assigned object to the prefix, so the object is the tail and the prefix is the head. We’re adding the IP address as the tail label with a font of size 8pt here. If we wanted some text on the prefix end of the edge, we would use headlabel. Who could have guessed that? 🙂
Line 32 is the one that shows us the graph. Line 31 logs the graph source, which is what’s used to render the diagram. It’ll show the graph attributes, nodes & attributes, and edges & attributes. This is actually what the layout engine uses to generate the diagram. Check out Edotor to play around with some of that source.
What happens when we run this thing? You’ll see a bunch of log messages, and your machine will open a PDF with a diagram using terrible colors.
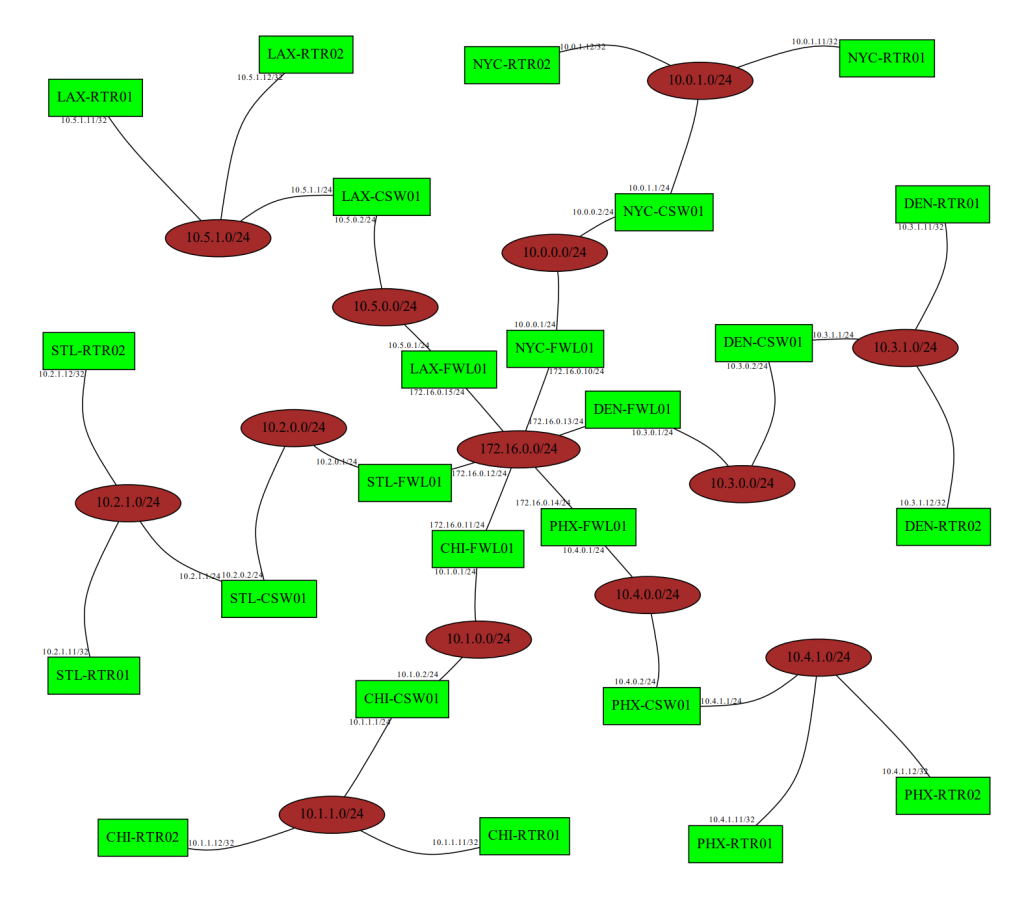
You can obviously play around with the colors to make it look better, but this will do nicely for a good number of audits or high-level presentations. And how many hours did we spend in Visio? Exactly the number that I like to spend — ZERO!
What’s going to break?
Since this is just a lab environment, the data in Netbox is pretty uniform and complete. In the real world, though, there will be stuff missing or unlinked. There needs to be some checking in there to make sure things like address.assigned_object.device.name actually exist.
What about prefixes or IP addresses that aren’t active? Deprecated? What about prefixes that are nested but not containers? 🤷🏼♂️
What if Netbox is offline or if your creds don’t work? Gotta have some exception handling for that.
What if you have 8472738 prefixes and 173474849294 addresses? The layout engine may struggle a bit with something that big.
Needed Improvements
First of all, fix the colors. Those are horrid. 🙂
The layout is “fine”. We probably want to use our layout hammer to get the thing looking better. And see comments about large networks.
Some node details would be great. Query the assigned object and get model and serial to add to the node?
Some boxes around each site would make this a lot more readable. Maybe even some descriptions on the prefixes to better understand what we’re seeing.
Send any welding supplies questions my way.
#python #pynetbox #netbox #graphviz #diagram #NetEng

https://masto.ai/@aconaway
- Generating Network Diagrams from Netbox with Pynetbox - August 23, 2023
- Out-of-band Management – Useful Beyond Catastrophe - July 13, 2023
- Overlay Management - July 12, 2023
hello,
good job, I’m looking for this feature in a netbox plug’in, not available for now.
Hope you find this useful. I know this is very rudimentary, but someone with more knowledge than I have could use it as a starter for a good plugin. 🙂
Hello Aaron,
You helped me out a while back with an upgrade of netbox. I was very greatful for that. Just wanted to touch base and say hello & thanks again for reaching out.
Michael
You’re welcome, my friend. Hope the upgrade went well.
I think I need to upgrade again soon, so let’s see how that goes. LOL