Nyansa Voyance at NFD18
Disclaimer : I was lucky enough to have been invited to attend Network Field Day 18 this past July in Silicon Valley. This event brings independent thought leaders to a number of IT product vendors to share information and opinions. I was not paid to attend any of these presentations, but Tech Field Day did provide travel, room, and meals for the event. There is no expectation of providing any blog content, and any posts that come from the event are from my own interest. I’m writing about Nyansa strictly from demonstrations of the product. I’ve not installed it on my own network and have no experience running it.
Anyway,…on with the show!
Nyansa (pronounced nee-ahn’-sa) is focused on user expereince on the access network. Their product, Voyance, analyzes data from a list of sources to provide a view into what client machines are seeing. This is more than just logs from the machine itself. We’re talkin about taking behaviors on the wireless, access network, WAN, and Internet, and correlating those data points to predict user experience issues and recommend actions to remediate those problems. As we discussed in the presentation, there are products that do each of these (wireless, access, WAN, Internet), but Voyance is built to use ALL of them to show exactly what’s going on with your users. I sat in with Nyansa last year at Network Field Day 14, and, to tell the truth, I had no interest in what they were offering. At the time, the focus for Voyance was on the wireless experience with some access thrown in there. Since that presentation, Nyansa has made big leaps to expand what it can see.
Check out this screengrab I took from the presentation.
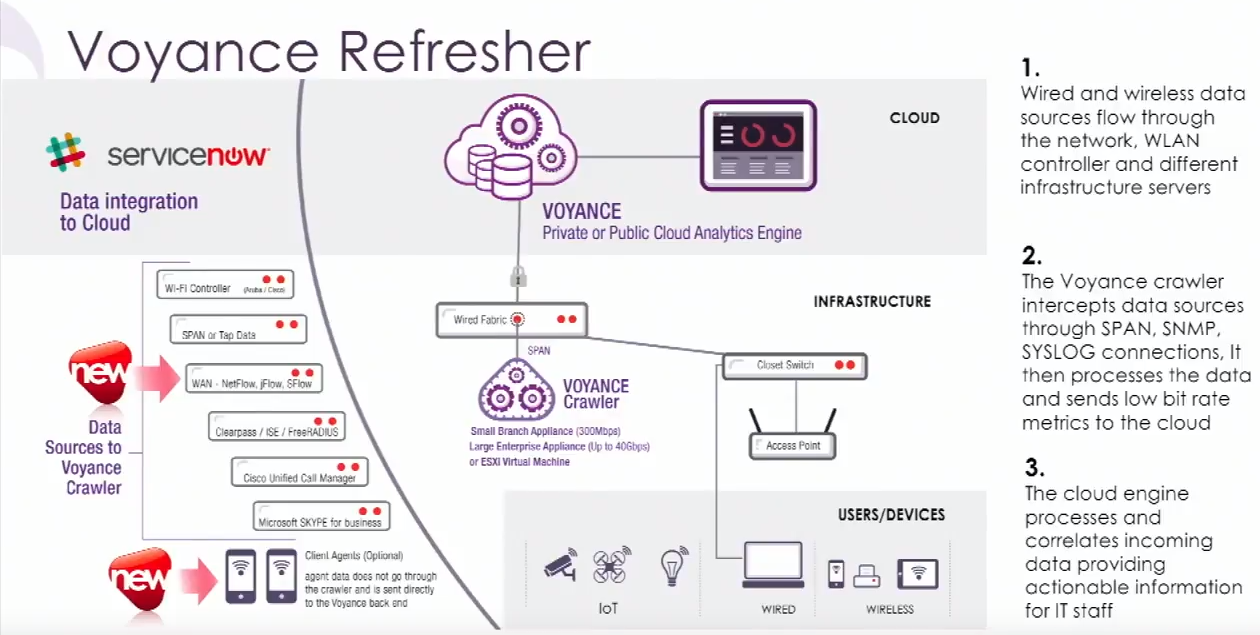
The big, shining star of the Voyance platform is the Crawler. This device sits on your network to collect data from all over the place. It talks to your wireless controllers to get data about the wireless clients (client densities, RFI, SNR, other wireless stuff I don’t really care about). It’s a SPAN destination so it can watch packets run across your network. It’s also a NetFlow server (sFlow and jFlow are coming, by the way), a syslog server, and an API client to get information from applications like Skype for Business. The Crawler does its magic on this data and sends the resulting metadata to a backend for the real crunching.
Why does it need so many data points? Simply put, the more you know, the better your decision is. If, for example, you were to focus on just Netflow data, you can see the source/destination info, when the flow started, how much data was sent, and when the flow ended. If your wireless network is having issues, NetFlow doesn’t really help you figure out why users are reporting problems. When you add other data sources like the packet data and wireless status, you can get a real picture of exactly what’s happening to the user and see what needs to be done. We’ve all gotten the ticket saying “the Internet is down” when it’s not, right? Voyance, with its wide data set, is able to show that your DHCP server is having issues, or your Internet circuit is saturated, or the admission server isn’t letting any new clients on the network.
One recent addition to the Voyance platform is the client agent. This is a piece of software that runs on your Windows, OSX, and Android machines (no iOS support) to provide yet another data point for analysis. My first reaction to this was “you already have all the data, why do you need this?” Well, you don’t have all the data, actually. If the client machine was having problems connecting to the wireless, you would never see that. If your users are remote and can’t VPN in due to local ISP issues, you wouldn’t get that information, either. The client agent reports those events from the user’s perspective right from the start, filling in those data gaps. The client agent also runs synthetic tests to your gateway, to the data center, to the Internet, to whatever, in order to compare against already-established baselines to know if the client is having issues or not. The client agent runs in the background, has minimal resource consumption, and provides a lot of data that could potentially be lost. It’s a good addition to the Voyance platform.
That’s enough about collecting data. Let’s see what information we can get out of all those data collection points.
We’re talking about user experience here, so baselines are probably the most important part of the analysis by Voyance. Is my 150ms ping time to the data center normal? Don’t know without a baseline. Voyance is able to tell you very easily that 150ms is great for that specific connection from Kansas City to Singapore since a baseline has been established with historical data. Let’s not forget, too, that latency is only one part of what’s measured here. Check out this screengrab that shows some of the baselines for sample sites.
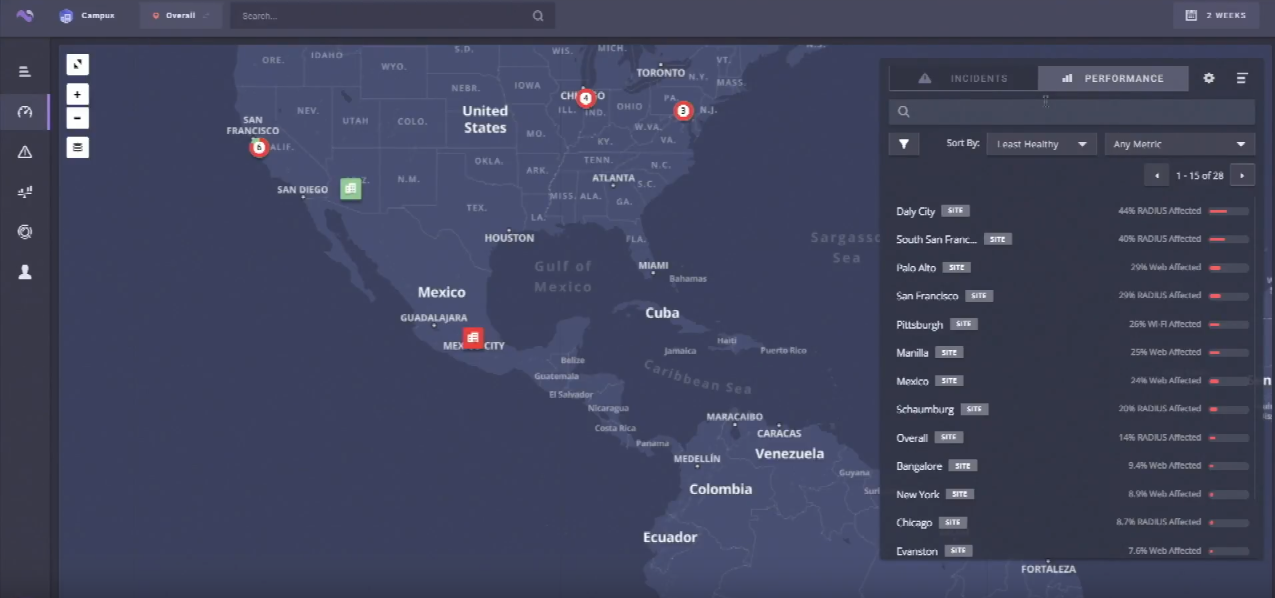
The performance tab shows that the Daly City and South San Francisco sites have a Radius problem where 44% of user are affected. Palo Alto, Manilla, Bangalore have problems getting to the Internet. Pittsburgh has wifi issues. These are established and measured baselines taken from data reported from the various sources. I guess we can consider this the norm.
Compare that screen to this one.
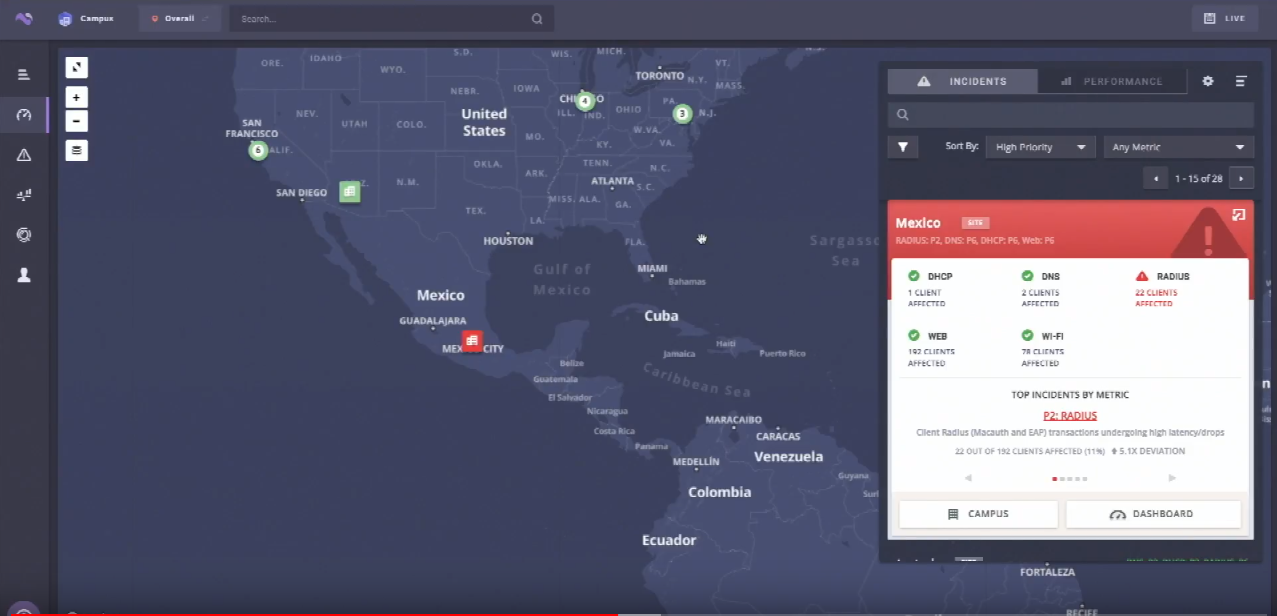
The incidents tab shows that the Mexico office is having problems with the Radius server. Eleven percent of user are being affected, which is a 5.1x deviation from the baseline. Since this measurement is in deviations from baseline, we know this is a new, atypical issue. Or at least the scale is atypical. What can we do about it?
Here’s a shot of the recommendations tab.
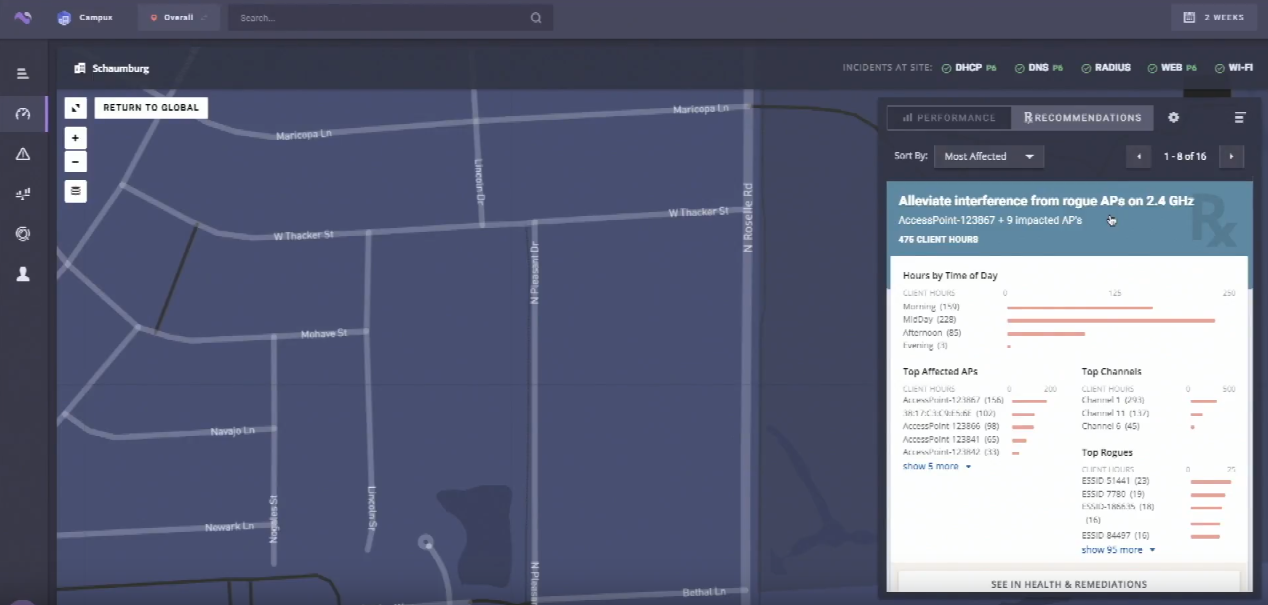
Not only does Voyance tell you what to fix but it also tells you the postive impact that the recommendation will make. This particular shot shows wifi problems in an office due to interference on the 2.4 GHz band from rogue APs. You can see a metric called client hours, which is one user having a poor experience in one hour. The wider the impact, the bigger this number will be. In this example, we see that fixing the interference will save 476 client hours. This number can be compared against other recommendations to maximize the impact of your time. If the Radius problem in Mexico calculates out to 210 client hours, then your time may be better spent dealing with the interference problem.
I’m kinda drooling a little here. I would love to have a tool that watched every step and hop in a user’s experience and let me know when things are going wrong. This is well beyond the traditional methods of monitoring where you have a million data sets that you have to correlate by hand. Think about an issue where a user reports that they can’t get to GMail. In a traditional top-down or bottom-up troubleshooting approaches, you would have to look at wireless statistics and logs, switch logs, firewall logs, router statistics, NetFlow data, SNMP data, etc., and try to match up events and statistics by hand (or by head). I’m afraid I’ve become a little too good at that over the years, but my junior network admin and our helpdesk can’t do that. Voyance can not only tell them what’s happening, but it can tell you what you should do about it. This is great stuff here.
Of course, there are some things Voyance doesn’t do.
- It’s not a tool designed to monitor your applications in your data centers. Though these can be used as client agent targets, Voyance isn’t going to provide the metrics you want when serving your own applications. You’ll want your own monitoring to fill that gap.
- Voyance is also not going to fix your network by itself. Nyansa is thinking about adding that feature, but, it doesn’t exist today. It’s also a whole new can of worms getting into the management arena. API calls into Voyance from your own tool were discussed as a viable option.
- It’s not a traditional monitoring system. Though that data is collected (and you can click enough to see that data), this system isn’t for showing you your link utilization or the number of clients on an AP. These are just pieces of the whole picture that Voyance knows about. If you insist on sending an alert when your WAN link gets over 80% utilized, stick with your current tool (since you’re totally missing the point here).
How many times have you been called in the middle of the night because the “Internet is down” in an office only to learn that the DHCP server isn’t responding any more. Or that “the network is down” because a user can’t connect to an application that’s crashed. A tool like Voyance can be a God-send for under-staffed helpdesks and even for the engineers in charge of the access network. Like I said earlier, I had no interest in Nyansa and Voyance the last time I spoke with them. Today’s features, though, round out that platform into something that has piqued my interest.
Check out Nyansa’s presentation at NFD18. Be sure to compare that to their NFD14 presentation. Their website is here.
Send any cool logos questions to me.
https://masto.ai/@aconaway
- Generating Network Diagrams from Netbox with Pynetbox - August 23, 2023
- Out-of-band Management – Useful Beyond Catastrophe - July 13, 2023
- Overlay Management - July 12, 2023
[…] Nyansa Voyance at NFD18 […]